VOL. 24, No. 3
Open access dissemination resonates with many distance education researchers and practitioners because it aligns with their fundmantal mission of extending access to learning opportunity. However, there remains lingering doubt whether this increase in access comes at a cost of reducing prestige, value (often determined in promotion and tenure hearings) or reference of the work by other authors. In this article, we examine 12 distance education journals (6 open and 6 published in closed format by commercial publishers). Using an online survey completed by members of the editorial boards of these 12 journals and a systematic review of the number of citations per article (N = 1,123) and per journal issue between 2003 and 2008, we examine the impact, and perceived value of the 12 journals. We then compute differences between open and closed journals. The results reveal that the open access journals are not perceived by distance eductation editors as significantly more or less prestigious than their closed counterparts. The number of citations per journal and per article also indicates little difference. However we note a trend towards more citations per article in open access journals. Articles in open access journals are cited earlier than in non-open access journals.
La diffusion par accès direct reçoit l’aval de nombreux chercheurs et praticiens du domaine de l’éducation à distance parce que celle-ci s’inscrit dans la lignée de leur mission fondamentale qui est d’augmenter l’accès aux opportunités d’apprentissage. Toutefois, un doute subsiste quant à savoir si cet accès accru se réalise ou non au coût d’une diminution du prestige, de la valeur (souvent déterminée au cours des entrevues de promotion et de titularisation) ou de la référence aux travaux par les autres auteurs. Dans cet article, nous examinons 12 revues d’éducation à distance (dont 6 sont à accès direct et 6 sont publiées en format fermé par des éditeurs commerciaux). À l’aide d’un sondage en ligne rempli par des membres des comités de rédaction de ces 12 revues et d’une revue systématique du nombre de citations par article (N = 1,123) et par édition de revue parue entre 2003 et 2008, nous examinons l’impact et la valeur perçue des 12 revues. Nous calculons ensuite les différences entre les revues à accès direct et les revues fermées. Les résultats révèlent que les éditeurs de l’éducation à distance ne perçoivent pas les revues à accès direct comme étant significativement plus ou moins prestigieuses que les revues fermées. Il y a aussi peu de différences au niveau du nombre de citations par journal et par article. Toutefois, nous notons une tendance vers un nombre plus élevé de citations par article dans les revues à accès direct. Les articles dans les revues à accès direct sont cités plus tôt que ceux des revues à accès non direct.
Publishing in distance education has two critically important functions. At the professional level the results of innovations, experiments, theoretical insights and pedagogical interventions increase the effectiveness and efficiency of education as we learn from and build upon the works of others. From an academic perspective, publication and review by peers, has become the means by which research is shared and as importantly the means by which contribution is measured and recognized and this has become a primary determinant of promotion and reputation. From both perspectives publication is of critical relevance for all those seriously involved in distance education.
But how does one know which is the best outlet for publication? Obviously one wants to publish in sources that are widely exposed within both professional and academic communities and published in journals that are known by reputation to have high standards for process, peer review and revision. The explosion of interest and increase in number of publications that release material in open access formats also complicates the decision making for authors. Open Access publication may result in higher exposure, but open access journals may be perceived as having a lower value than older more well established closed outlets.
The purpose of this research is to survey 12 major distance education journals from 2003 to 2008 (N = 1,416 articles), to investigate the relative prestige and perceived quality of these journals and to determine if open access journals are becoming more influential in distance education publications.
This study is therefore guided by the following questions:
Our hypothesis is that the impact of open access journals in terms of average citations per article and year (b1) between 2003 and 2008 is significantly higher than the impact of closed journals (b2), thus:
H1: b1 > b2
In 2006 there were over 23,000 scholarly journals, publishing 1.4 million articles a year, and creating a $5 billion industry that employs approximately 90,000 persons (Ware, 2006). Distance education as practice, scholarship and focus of research is one of thousands of disciplines that create both consumers and producers of scholarly journals. The global trend towards increasing numbers of distance education researchers, programs, courses, teachers and students has been matched by increase in the number and the variety of distance education journals.
Scholarly journals are published under one of two models. In the older 'closed' publication model, a commercial publisher, university press or a professional association edits and publishes the journal and generates revenue from the sale of individual issues or articles, subscriptions or, more often today, by sale of aggregated databases of articles to libraries. Open access journals are most often published by a sponsor (often a university, professional organization, or government agency) and the content is distributed freely to subscribers on the open web and via aggregated databases. Importantly, no fees or subscription costs, institutional or organizational membership is required in order to read the full text of open access journal articles. The Directory of Open Access Journals (DOAJ) indexes more than 4,820 full text and quality controlled scholarly journals, covering most academic disciplines (DOAJ, 2010).
Harnad et al. (2008) have argued that a hybrid model exists for wider distribution of scholarly work that has advantage for both commercial publishers and researchers. They refer to open access publishing as the "gold option" but have concerns with its sustainability. They argue that a "green model" in which authors archive their full text work on institutional repositories allows for both commercial viability of closed access journals and access by the public. Although Harnad et al. (2008) claim that over 90% of closed published journals allow self archiving, research has shown that the percentage of authors who do self archive is very low, unless this is a requirement to do so as a condition of their employment (Thomas & McDonald, 2007). In addition, some publishers demand a quarantine period of time (typically one year) before authors are allowed to self-archive copyright materials. Finally, the distributed nature of self archives makes serendipitous browsing of related articles more challenging (i.e., special issue articles are not gathered together) and forces users to be very efficient search engine users. Finally, our research notes that search engines often miss critical articles in self-archived repositories. The use of specific peer-to-peer-networks for open content and social search engines could be solutions for sharing and retrieving information generally — not just for the scientific community.
Given the high stakes associated with publication in research awards and individual promotion and tenure hearings, there has been considerable interest in determining the impact of journal publication in all fields of study. The study of the effect of specific journal publication is referred to as bibliometrics – a generic term for a whole range of specific measurement indicators. Its purpose is to measure the output of scientific and technological research through data derived not only from scientific literature but patents as well (Okubo, 1997).
Open Access journals have a broadly similar citation pattern and impact to other journals, but may have a slight tendency to earlier citations (TSI, 2004). Proponents of open access argue that any form of distribution restriction results in the loss of potential research impact (see Harnad et al, 2004). A number of studies in different subject areas demonstrate that open access increases impact (e.g., Lawrence, 2001; Brody et al., 2004; Kurtz, 2004; Hajjem, Harnad & Gingras, 2005; Hitchcock, 2005; Eysenbach, 2006; Norris, Oppenheim & Rowland, 2008; Kousha & Abdoli, 2009).
Researchers often discover differences among disciplines in relationship to the impact of open versus closed publication. Lawrence (2001) showed that free online availability substantially increases a paper's impact and that more highly cited articles and more recent articles in computer science are significantly more likely to be online. He reported that citations in computer science conference papers were three times higher for open access proceedings than for those published in non-open access formats. Hajjem, Harnad and Gingras (2005) conducted a multidisciplinary research study of a 12-year sample (1992-2003) of nearly 14 million articles to present a more general view of citation impact of open access journals in 10 different disciplines including biology, psychology, sociology, health, political science, economics, education, law, business, and management. They extracted citation data from the ISI database and used a robot to crawl the Web for locating open access (self-archived) versions of the articles published in non-open access journals. The overall results showed that open access articles had more citations than non-open access articles. The citation advantage of open access articles varied from 36% to 172% by discipline and year.
Other studies present contradicting findings. For instance Davis et al. (2008) found no evidence of a citation advantage for open access articles in the first year after publication. They concluded that the citation advantage from open access reported widely in the literature may be an artefact of other causes. Davis (2009) conducted a research study on biomedical sciences journals and found that the open access advantage is declining. This may be due to the increase in access afforded to researchers associated with universities that subscribe to databases containing thousands of closed peer reviewed journals, coupled with the increase in self-archiving, providing open access to copyright (closed) articles.
From this literature we can conclude that disciplinary differences exist among use, perceptions of prestige, access and citation results between open and closed publication models and that these results may be changing over time. Thus, it is important to research the relative impact of publications in the field of distance education and attempt to quantify the impact over time.
Selected Journals
Table 1 provides an overview of the 12 journals (6 open access and 6 closed access) that were reviewed for this study. They were selected based upon of their reputations as the most prominent and recognized journals in the field of distance education.
All full-papers published in these journals between 2003 and 2008 are in the sample (N = 1,416). Editorials, field notes, book reviews and other non-research papers are excluded. The year 2003 was selected as the starting date because the Asian Journal of Distance Education and the International Journal of Distance Education Technologies were released in 2003 for the first time. Since articles need at least one year to generate citations (McVeigh, 2004), the year 2008 was chosen as a cut-off date.
Table 1: Selected Distance Education Journals
| Journal, Country, URL | Access | Launched | |
| American Journal of Distance Education, AJDE (USA) (http://www.ajde.com) | Closed |
|
|
|
Open |
2003 |
|
Distance Education, DE (Australia) |
Closed |
1980 |
|
European Journal of Open, Distance and E-Learning, EURODL (UK, Hungary) (http://www.eurodl.org) |
Open |
1997 |
|
Indian Journal of Open Learning, IJOL (India) |
Closed |
1992* |
|
International Journal of Distance Education Technologies, IJDET (USA) (http://jdet.mine.tku.edu.tw) |
Closed |
2003 |
|
International Review of Research in Open and Distance Learning, IRRODL(Canada) (http://www.irrodl.org) |
Open |
2000 |
|
Journal of Distance Education, JDE (Canada) |
Open |
1986 |
|
Online Journal of Distance Learning Administration, OJDLA (USA) (http://www.westga.edu/~distance/ojdla/) |
Open |
1998 |
|
Open Learning, OL (UK) |
Closed |
1986 |
|
Quarterly Review of Distance Education, QRDE (USA) |
Closed |
2000 |
|
Turkish Online Journal of Distance Education, TOJDE (Turkey) (http://tojde.anadolu.edu.tr/) |
Open |
2000 |
*latest issue published in January, 2008; re-launched in 2009 in an open access format (http://journal.ignouonline.ac.in/iojp/index.php/IJOL)
According to Elbeck & Mandernach (2009), there are two general approaches to scholarly journal bibliometric assessmentFN1:
The first is based on citation analysis (e.g. Baumgartner & Pieters, 2003; Jobber & Simpson, 1988). The advantages and disadvantages of citation analysis to measure impact are discussed in the following section. The second approach to journal ranking examines perceptions of style or content, acceptance rates, readership, distribution and prestige and other qualitative assessments of a journal (e.g., Mylonopoulos & Theoharakis, 2001; Nisonger, 1999; Hult, Neese, & Bashaw, 1997; Luke & Doke, 1987).
In this study we follow Elbeck & Mandernach's suggestion to combine citation and perception data to measure the impact of a journal.
Many of the studies mentioned above determine citation counts based upon the proprietary ISI (or Web of Science, WoS) ranking system developed and maintained by Thompson Publishing — a major commercial publisher. Meho & Yang (2007) argue that ISI databases are "no longer sufficient because new databases and tools that allow citation searching are now available" (p. 2105). Critics of ISI citation databases note that they a) cover mainly English-language journals from North America and Europe; b) are limited to only 8,700 journalsFN2; c) do not count citations from books and conference proceedings; and d) provide different coverage between research fields.
Regrettably, ISI does not rate any of the 12 major distance education journals. Our own experience suggests that Thompson has little interest in indexing and calculating impact factors for journals in relatively small disciplines and especially those that compete with it as open access publications. Similar to ISI, Elsevier, producer of the Scopus citation database, provides access to over 15,000 titles, among them only IRRODL and IJDET.
Fortunately, we were able to gather data on citations on most of the 12 journals using Google Scholar (GS) data. GS automatically extracts bibliographic information and cited references from online full-text documentsFN3. We used "Publish or Perish" which is a free software program that retrieves and analyzes academic citations from GS and presents statistics such as the total number of papers/citations, the average number of citations per year/author, Hirsh's h index and other related parameters.FN4
Although GS finds articles from all the 12 journals, GS does not find all full papers that were published between 2003 and 2008. Table 2 provides an overview of GS coverage.
Table 2: Google Scholar Coverage
Journal |
Open Access? |
NTotal* |
NGS** |
Coverage (%) |
AJDE |
Closed |
74 |
74 |
100.0 |
DE |
Closed |
108 |
106 |
98.1 |
OJDLA |
Open |
155 |
151 |
97.4 |
IRRODL |
Open |
113 |
104 |
92.0 |
JDE |
Open |
68 |
58 |
85.3 |
OL |
Closed |
105 |
93 |
88.6 |
QRDE |
Closed |
133 |
105 |
78.9 |
IJDET |
Closed |
136 |
104 |
76.5 |
TOJDE |
Open |
255 |
184 |
72.2 |
IJOL |
Closed |
92 |
63 |
68.5 |
AsianJDE |
Open |
77 |
48 |
62.3 |
EURODL |
Open |
100 |
33 |
33.0 |
Total |
|
1,416 |
1,123 |
|
* Total number of articles published in the journals between 2003 and 2008
** Total number of articles found by GS in the same time period
Due to the low coverage of EURODL in GS we decided to exclude this journal from the citation analysis since it would not lead to valid results.
The number of citations grows over time. Therefore, the data was collected for all journals within two weeks in October 2009. In this time period GS generated a stable number of citations so that the results are comparable between journals.
As the main indicators for the impact of a journal we use the average number of cites per paper and Hirsh's h index: "A scientist [or a journal] has index h if h of his/her Np papers have at least h citations each, and the other (Np-h) papers have no more than h citations each" (Hirsch, 2005, p. 16569).
To collect perception data, an online survey was sent to all members of editorial boards of the 12 journals. The questionnaire was completed by 83 of 277 editorial board members (30% response rate).
Recipients were instructed as follows (Nelson, Buss & Katzko, 1983): "Please assign numbers to the journals listed below according to how you would rate them, where 5 = outstanding, 4 = excellent, 3 = good, 2 = adequate, 1 = poor. You may leave blanks if you do not recognize a journal" (p. 475).
Furthermore, the editors were asked to rate the journals according to their exposure to journal's scholarly articles, where 5 = outstanding (I read or scan most articles in nearly every issue), 4 = excellent (I read many articles and scan the table of contents in nearly every issue), 3 = good (I often read articles that I retrieve from this journal), 2 = adequate (I occasionally read articles from this journal), 1 = poor (I almost never or never look at articles from this journal).
Limitation: We acknowledge the bias of editorial board members who are more aware of their 'own' journal and are likely prejudiced towards perceiving quality in that journal, however we also believe that these are likely most informed consumers of distance education research and thus their opinion and perceptions of value are useful. The following two tables show that editors rate their own journal significantly higher than non-editors and that they are – as to be expected – more exposed to their journal than to others.
Table 3: Differences in Ratings of a Journal Comparing Non-editors and Editors
Journal |
Non-Editor |
Editor |
|
||||||
M |
SD |
n |
M |
SD |
n |
t |
df |
Sig. |
|
AJDEa |
3.86 |
.90 |
63 |
3.88 |
.84 |
8 |
-.05 |
69 |
.957 |
Asian JDEb |
2.85 |
.87 |
33 |
3.10 |
1.20 |
10 |
-.73 |
41 |
.468 |
DEa |
3.80 |
.80 |
51 |
4.19 |
.75 |
16 |
-1.70 |
65 |
.095 |
EURODLb |
3.46 |
.84 |
50 |
3.80 |
1.03 |
10 |
-1.13 |
58 |
.265 |
IJOLa |
2.79 |
.88 |
34 |
2.77 |
1.17 |
13 |
.08 |
45 |
.937 |
IJDETa |
3.38 |
1.06 |
40 |
4.13 |
.99 |
8 |
-1.85 |
46 |
.070 |
IRRODLb |
4.02 |
.92 |
49 |
4.52 |
.51 |
21 |
-2.34 |
68 |
.022* |
JDEb |
3.80 |
.83 |
54 |
4.14 |
.69 |
7 |
-1.05 |
59 |
.297 |
OJDLAb |
3.14 |
.88 |
44 |
4.50 |
.58 |
4 |
-3.03 |
46 |
.004* |
OLa |
3.80 |
.99 |
55 |
4.00 |
.67 |
10 |
-.61 |
63 |
.542 |
QRDEa |
3.44 |
.85 |
48 |
4.33 |
.58 |
3 |
-1.79 |
49 |
.079 |
TOJDEb |
2.61 |
.90 |
33 |
3.81 |
.98 |
16 |
-4.28 |
47 |
<.001* |
*significant at alpha = 0.05 level; a = closed, b = open
By Fisher’s combined probability test (cf. Winer, 1971, p. 49), we have χ2(24) = 84.86, p < .001, which indicates that there is a statistical significant difference between editors and non-editors in terms of their ratings by combining all the journals.
Table 4: Differences in Exposure to a Journal Comparing Non-editors and Editors
Journal |
Non-Editor |
Editor |
|
||||||
M |
SD |
n |
M |
SD |
n |
t |
df |
Sig. |
|
AJDEa |
3.37 |
1.07 |
65 |
3.50 |
1.07 |
8 |
-.33 |
71 |
.745 |
Asian JDEb |
2.30 |
1.11 |
40 |
3.18 |
1.47 |
11 |
-2.17 |
49 |
.035* |
DEa |
3.36 |
1.05 |
50 |
4.25 |
.58 |
16 |
-3.24 |
64 |
.002* |
EURODLb |
3.15 |
1.09 |
54 |
3.80 |
.92 |
10 |
-1.78 |
62 |
.081 |
IJOLa |
2.16 |
1.15 |
38 |
3.46 |
1.33 |
13 |
-3.39 |
49 |
.001* |
IJDETa |
2.63 |
1.04 |
48 |
4.00 |
1.00 |
7 |
-3.27 |
53 |
.002* |
IRRODLb |
3.58 |
1.11 |
48 |
4.19 |
.60 |
21 |
-2.36 |
67 |
.021* |
JDEb |
3.32 |
1.18 |
56 |
4.29 |
.49 |
7 |
-2.13 |
61 |
.037* |
OJDLAb |
2.56 |
1.09 |
48 |
3.75 |
.96 |
4 |
-2.11 |
50 |
.040* |
OLa |
3.22 |
1.16 |
54 |
3.90 |
.88 |
10 |
-1.75 |
62 |
.085 |
QRDEa |
2.92 |
1.11 |
48 |
5.00 |
.00 |
3 |
-3.23 |
49 |
.002* |
TOJDEb |
2.42 |
1.21 |
36 |
3.80 |
1.32 |
15 |
-3.64 |
49 |
.001* |
Here we have χ2(24) = 102.92, p < .001, which indicates that there is also a statistical significant difference between editors and non-editors in terms of their exposure to the journals by combining all the journals.
The following table shows the results of the citation analysis for the 12 journals and for the time period between 2003 and 2008 (N = 1,123 papers). The most cited papers are presented in Table 6. The top two papers were published in open access journals.
Table 5: Citation Analysis of 12 Distance Education Journals (N = 1,123 papers since 2003)
|
Number of Papers |
|||||
Journal |
2003 |
2004 |
2005 |
2006 |
2007 |
2008 |
AJDEa |
74 |
62 |
49 |
36 |
24 |
12 |
Asian JDEb |
48 |
44 |
41 |
33 |
27 |
14 |
DEa |
106 |
92 |
79 |
59 |
39 |
21 |
IJOLa |
63 |
50 |
32 |
21 |
16 |
1 |
IJDETa |
58 |
54 |
45 |
35 |
26 |
14 |
IRRODLb |
104 |
91 |
77 |
57 |
41 |
21 |
JDEb |
58 |
54 |
45 |
35 |
26 |
14 |
OJDLAb |
151 |
124 |
100 |
69 |
45 |
22 |
OLa |
93 |
80 |
64 |
46 |
30 |
13 |
QRDEa |
108 |
89 |
73 |
52 |
30 |
12 |
TOJDEb |
184 |
161 |
135 |
114 |
73 |
40 |
|
Number of Cites |
|||||
AJDEa |
1094 |
710 |
474 |
160 |
69 |
17 |
Asian JDEb |
83 |
70 |
53 |
51 |
47 |
34 |
DEa |
1397 |
1097 |
852 |
462 |
156 |
76 |
IJOLa |
42 |
32 |
12 |
0 |
0 |
0 |
IJDETa |
420 |
294 |
206 |
93 |
23 |
4 |
IRRODLb |
1040 |
647 |
381 |
267 |
182 |
58 |
JDEb |
357 |
243 |
116 |
56 |
35 |
20 |
OJDLAb |
1381 |
700 |
502 |
155 |
71 |
17 |
OLa |
913 |
713 |
276 |
154 |
101 |
9 |
QRDEa |
492 |
365 |
282 |
149 |
59 |
5 |
TOJDEb |
301 |
229 |
173 |
134 |
70 |
19 |
|
Cites per Paper |
|||||
AJDEa |
14.78 |
11.45 |
9.67 |
4.44 |
2.88 |
1.42 |
Asian JDEb |
1.73 |
1.59 |
1.29 |
1.55 |
1.74 |
2.43 |
DEa |
13.18 |
11.92 |
10.78 |
7.83 |
4.00 |
3.62 |
IJOLa |
0.67 |
0.64 |
0.38 |
0.00 |
0.00 |
0.00 |
IJDETa |
4.04 |
3.50 |
3.12 |
2.07 |
1.15 |
.44 |
IRRODLb |
10.00 |
7.11 |
4.95 |
4.68 |
4.44 |
2.76 |
JDEb |
6.16 |
4.50 |
2.58 |
1.60 |
1.35 |
1.34 |
OJDLAb |
9.15 |
5.65 |
5.02 |
2.25 |
1.58 |
0.77 |
OLa |
9.82 |
8.91 |
4.31 |
3.35 |
3.37 |
0.69 |
QRDEa |
4.56 |
4.10 |
3.86 |
2.87 |
1.97 |
0.42 |
TOJDEb |
1.64 |
1.42 |
1.28 |
1.18 |
0.96 |
0.48 |
|
Hirsch index (h) |
|||||
AJDEa |
19 |
16 |
13 |
6 |
5 |
3 |
Asian JDEb |
4 |
4 |
4 |
4 |
4 |
3 |
DEa |
22 |
19 |
16 |
11 |
7 |
5 |
IJOLa |
3 |
3 |
1 |
0 |
0 |
0 |
IJDETa |
11 |
9 |
7 |
5 |
3 |
1 |
IRRODLb |
15 |
12 |
9 |
8 |
7 |
4 |
JDEb |
8 |
8 |
4 |
3 |
3 |
3 |
OJDLAb |
20 |
13 |
12 |
6 |
4 |
2 |
OLa |
17 |
15 |
9 |
7 |
6 |
2 |
QRDEa |
11 |
10 |
9 |
7 |
5 |
2 |
TOJDEb |
8 |
7 |
6 |
6 |
4 |
2 |
a = closed, b = open
At this stage, three journals have to be excluded from the further analysis: EURODL, because the data is not complete (only 33% of articles covered with GS, cf. Table 2) and furthermore the Asian Journal of Distance Education (AsianJDE) and the Indian Journal of Open Learning (IJOL) because the total number of citations is so low that they would produce a bias, i.e. the results would be inflated by a small number of 'big hits' or 'one hit wonders' (highly cited articles), which are not representative for the journal.
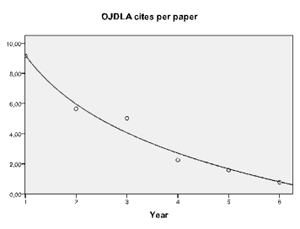
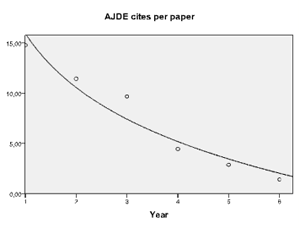
The development of the impact of a journal can be described in terms of cites per paper which decline from 2003 to 2008 (Table 5). The years are recoded (2003 = 1, 2004 = 2, etc.) and a simple logarithmic regression is performed using the year as the single predictor which produces the best fit, i.e., y = b0 + b1* ln(year). The dependent variable that we use for each journal is 'cites per paper'.
We interpret the regression coefficients (b1 values) as a measure for the slope of the curve to describe the development of impact based on cites per paper. The steeper the curve declines the more impact a journal looses from 2003 to 2008. Figure 1 exemplary illustrates the citation slopes for OJDLA (R2 = .975) and AJDE (R2 = .940).
Table 6: Most Cited Papers in the 12 Journals Published Between 2003 and 2008 (as of October 8, 2009)
Cites |
Author |
Year |
Title |
Journal |
158 |
Anderson |
2003 |
Getting the mix right again: An updated and theoretical rationale for interaction |
IRRODLb |
149 |
Howell, Williams, & Lindsy |
2003 |
Thirty-two trends affecting distance education: an informed foundation for strategic planning |
OJDLAb |
132 |
Osguthorpe & Graham |
2003 |
Blended learning environments: definitions and directions |
QRDEa |
115 |
Jeong |
2003 |
The sequential analysis of group interaction and critical thinking in online threaded discussions |
AJDEa |
90 |
Rovai & Barnum |
2003 |
On-line course effectiveness: an analysis of student interactions and perceptions of learning |
JDEb |
84 |
Beldarrain |
2006 |
Distance education trends: Integrating new technologies to foster student interaction and collaboration |
DEa |
71 |
Dickey |
2004 |
The impact of web-logs (blogs) on student perceptions of isolation and alienation in a web-based distance-learning environment |
OLa |
27 |
Sicilia & Barriocanal |
2005 |
On the convergence of formal ontologies and standardized e-learning |
IJDETa |
27 |
McPherson & Baptista Nunes |
2004 |
The role of tutors as an integral part of online learning support |
EURODLb |
15 |
Edirisingha, Rizzi, Nie, & Rothwell |
2007 |
Podcasting to provide teaching and learning support for an undergraduate module on English language and communication |
TOJDEb |
15 |
Turoff, Hiltz, Yao, Li, Wang & Cho |
2006 |
Online collaborative learning enhancement through the Delphi method |
TOJDEb |
14 |
Naidu |
2004 |
Trends in faculty use and perceptions of e-Learning |
AsianJDEb |
6 |
Kanjilal, Ghosh & Kumar |
2004 |
Web enhanced training programme on WINISIS: IGNOU-DSIR Initiative |
IJOLb |
a = closed, b = open
The development of the impact of a journal can be described in terms of cites per paper which decline from 2003 to 2008 (Table 5). The years are recoded (2003 = 1, 2004 = 2, etc.) and a simple logarithmic regression is performed using the year as the single predictor which produces the best fit, i.e., y = b0 + b1* ln(year). The dependent variable that we use for each journal is 'cites per paper'.
We interpret the regression coefficients (b1 values) as a measure for the slope of the curve to describe the development of impact based on cites per paper. The steeper the curve declines the more impact a journal loses from 2003 to 2008. Figure 1 exemplary illustrates the citation slopes for OJDLA (R2 = .975) and AJDE (R2 = .940).
|
|
Figure 1: Citations per paper from year 1 = 2003 to 6 = 2008 (OJDLA and AJDE)
Table 7 depicts that the slopes are all negative and ln(year) significantly predicts (p < 0.05) the dependent variable 'cites per paper', which indicates that 'cites per paper' decreases with the natural logarithm of the year, which in turn decreases with the year. If we look at the R-squares, it ranges from .765 to .975 which provides a moderate to excellent fit of the regression model.
Table 7: Logarithmic Regression (nine journals)
Journal |
Slope (b1) |
R2 |
AJDEa |
-7.772* |
.940 |
DEa |
-5.649* |
.841 |
IJDETa |
-1.975* |
.864 |
IRRODLb |
-3.766* |
.965 |
JDEb |
-2.921* |
.959 |
OJDLAb |
-4.691* |
.975 |
OLa |
-5.089* |
.904 |
QRDEa |
-20.56* |
.765 |
TOJDEb |
-.548* |
.803 |
* significant at alpha = 0.05 level; a = closed, b = open
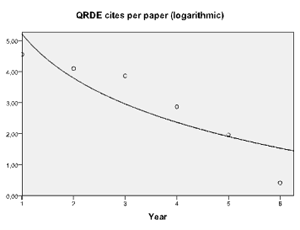
QRDE behaves quite differently compared to the other journals (Figure 2). Applying a cubic model defined by the equation y = b0 + (b1<*t) + (b2*t2) + (b3*t3) provides a much better fit with R2 = .996.
 |
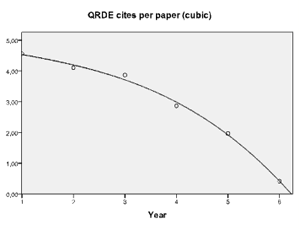 |
Figure 2: Citations per paper from year 1 = 2003 to 6 = 2008 for QRDE (logarithmic and cubic model)
Figure 3 shows the percentages of the six years total citations (2003 = 100%) between open access (JDE, IRRODL, OJDLA, TOJDE) and closed access (AJDE, DE, IJDET, OL) journals and reveals that the articles in open access journals are cited more quickly. QRDE is excluded from this analysis due to its poor fit to the logarithmic model.
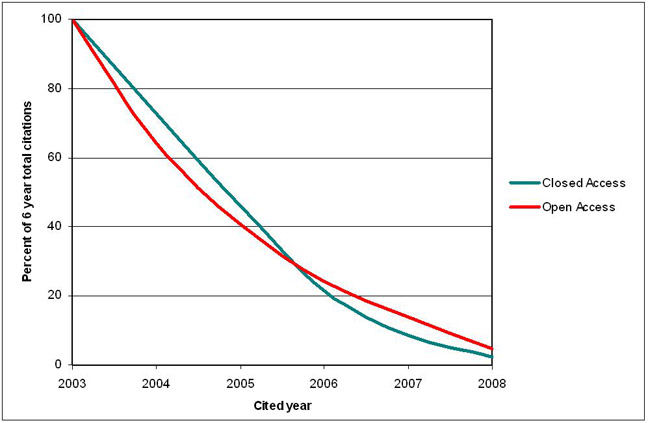
Figure 3: Percentages of 6 year total citations (observed values)
To test for the difference between slopes of open access and closed journals a simple logarithmic regression is performed with the two groups (open/closed).
Table 8: Logarithmic Regression (two journal groups)
Journal Group |
Slope |
R2 |
SE |
| Open Journal | -2.981* (b1) |
.468 |
.678 |
| Closed Journal | -5.121* (b2) |
.533 |
1.022 |
* significant at alpha = 0.05 level
To test for the difference between the two regression coefficients a z-test is carried out based on the formula suggested by Paternoster et al. (1998, p. 862):

In comparing the slopes of these two regression coefficients, closed journals decrease faster (i.e., lose impact) than open journals. However, the two slopes are not statistically significant different from each other at the 5% confidence level (z = 1.73, p = .08).
Thus, we have to accept H0: b1(open) = b2(closed).
Rating of Journals
The average ratings for each journal are presented in the following table.
Table 9: Rating of Distance Education Journals by Editorial Board Members
Journal |
N* |
Mean |
SD |
IRRODLb |
70 |
4.17 |
.85 |
DEa |
67 |
3.90 |
.80 |
AJDEa |
71 |
3.86 |
.88 |
JDEb |
61 |
3.84 |
.82 |
OLa |
65 |
3.83 |
.95 |
EURODLb |
60 |
3.52 |
.87 |
IJDETa |
48 |
3.50 |
1.07 |
QRDEa |
51 |
3.49 |
.86 |
OJDLAb |
48 |
3.25 |
.93 |
TOJDEb |
49 |
3.00 |
1.08 |
AsianJDEb |
43 |
2.91 |
.95 |
IJOLa |
47 |
2.79 |
.95 |
* total number of ratings; a = closed, b = open
Figure 4 depicts error bar graphs with a 95% confidence interval showing a top group of five journals (IRRODL, DE, AJDE, JDE, and OL), a second group of three journals (EURODL, IJDET, and QRDE) followed by a third group that was rated significantly lower than the top group (OJDLA, TOJDE, AsianJDE, and IJOL). The top rated journal is IRRODL which might be due to the relative high number of editors who participated (cf. Table 3).
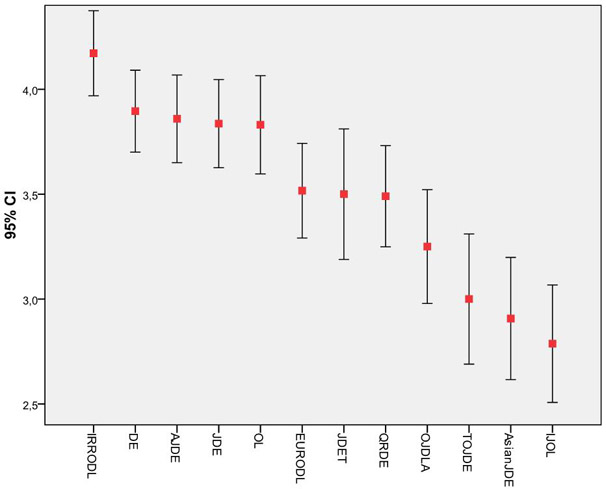
Figure 4: Error Bar Graph for Journal Ratings (95% confidence interval, with 1 = poor and 5 = outstanding)
When comparing the open to the closed journals we find the mean rating for the open journals to be 3.43 with SD of .62; closed journals had slightly higher, but not significantly different prestige ratings averaging 3.62 with SD of .515. However, it is useful to note that the standard deviation is considerably higher for the open access journals, which may be related to their relative youthfulness.
Exposure to a journal was rated on a scale from 1 = poor (I almost never look at articles from this journal) to 5 = outstanding (I read or scan most articles in nearly every issue). Exposure and ratings of each journal (cf. Table 9) are correlated on a highly significant level in a positive direction (Table 10).
Table 10: Exposure to Journals by Editorial Board Members and Correlation between Rating and Exposure
Journal |
N |
Mean |
SD |
r* |
IRRODLb |
69 |
3,77 |
1,017 |
.501 |
DEa |
66 |
3,58 |
1,024 |
.479 |
JDEb |
63 |
3,43 |
1,160 |
.455 |
AJDEa |
73 |
3,38 |
1,062 |
.486 |
OLa |
64 |
3,33 |
1,142 |
.603 |
EURODLb |
64 |
3,25 |
1,084 |
.553 |
QRDEa |
51 |
3,04 |
1,183 |
.607 |
TOJDEb |
51 |
2,82 |
1,381 |
.738 |
IJDETb |
55 |
2,80 |
1,129 |
.564 |
OJDLAa |
52 |
2,65 |
1,118 |
.531 |
AsianJDEa |
51 |
2,49 |
1,239 |
.610 |
IJOLb |
51 |
2,49 |
1,317 |
.614 |
* Pearson correlation between rating and exposure, significant at the 0.01 level (2-tailed); a = closed, b = open
When comparing the open to the closed journals we find the mean rating for access to the open journals to be 3.08 (SD = .81); closed journals had almost identical access ratings averaging 3.09 (SD = .73).
Correlations of exposure data reveal that there are regional clusters of some journals in terms of their readership, e.g. readers of the Asian Journal of Distance Education also read the Indian Journal of Open Learning (r = .815, p < 0.01). And there is another group of North American journals: Readers of the Quarterly Review of Distance Education are also exposed to articles in the American Journal of Distance Education (r = .470, p < 0.01), the Online Journal of Distance Learning Administration (r = .639, p < 0.01), and the Journal of Distance Education (r = .410, p < 0.01). It is likely that open access journals are read more often, especially in developing countries, where access to closed issues is not available. However, this cannot be confirmed based on our data.
This study provides multiple ratings for each of the 12 most popular distance education journals. We hope the results will guide both authors and readers in selecting outlets for their research work, and input for their reading of distance education issues, theories and research results. We note however that the longitudinal data demonstrates that the number of citations produced by articles in a journal has changed over time and likely the perceptions of prestige and access change as well. Thus, these results are a snap shot of ratings in October 2009. Readership and publication outlet also has regional implications, as distance educators and researchers may wish to read and publish in journals that are related to and read by audiences from specific countries or regions – others will value a journal for its international scope. Thus, the effect of regional importance, though not discussed nor assessed in this article, may have an important bearing on journal readership.
These results show that in the distance education discipline open and closed journals are not significantly different in terms of prestige or access as assessed by experts nor differentiated in the number of citations. However, analysis of the slopes of graphs of increasing citations over time after release indicates that open access journals are more quickly cited and may be increasing in number of citations per article in recent years. This study should be repeated in future years to gauge the impact over time of open versus closed journals.
We conclude this article with a brief discussion of the most important attribute of open access publications- that being accessibility to all citizens of the world, not just for those employed at well-funded universities. Publishing in open access journals is but one of the attributes of open scholarship. Gideon Burton (2009) argues that "Open Access is more than a new model for scholarly publishing; it is the only ethical move available to scholars who take their own work seriously enough to believe its value lies in how well it engages many publics and not just a few peers." Distance educators and scholars in many areas of the world do not have access to closed research publications. Unfortunately, the data collected does not allow us to speak to the accessibility of open versus closed journals in developing countries nor by those distance educators who work in businesses, schools and many colleges whose libraries do not subscribe to scholarly journals – an interesting perspective for future research.
We hope the results of this study demonstrate that publishing in open access journals does not negatively impact the number of citations, nor the perceptions of value by experts in the field.
Baumgartner, H., & Pieters, R. (2003). The structural influence of marketing journals: A citation analysis of the discipline and its sub-areas over time. Journal of Marketing, 67(2), 123-39.
Brody, T., Stamerjohanns, H., Harnad, S. Gingras, Y. Vallieres, F. & Oppenheim, C. (2004). The effect of Open Access on Citation Impact. Presented at: National Policies on Open Access (OA) Provision for University Research Output: an International meeting. Southampton University, Southampton UK.
Burton, G. (2009, April Academic Evolution Blog Scholar or Public Intellectual? [Web log message]. Retrieved from: http://www.academicevolution.com/2009/04/index.html
Davis, P., Lewenstein, B., Simon, D., Booth, J., & Connolly, M. (2008). Open access publishing, article downloads, and citations: randomised controlled trial. British Medical Journal, 337-568. DOI: 10.1136/bmj.a568
Davis, M. (2009). Author-Choice Open-Access Publishing İn The Biological And Medical Literature: A Citation Analysis. Journal of the American Society for Information Science and Technology, 60(1), 3 - 8.
DOAJ (Directory of Open Access Journals). Retrieved March 15, 2010, from: http://www.doaj.org
Elbeck, M., & Mandernach, B. J. (2009). Journals for computer-mediated learning: publications of value for the online educator. International Review of Research in Open and Distance Learning, 10(3), 1-20.
Eysenbach G. (2006). Citation advantage of Open Access articles. PLoS Biol 4(5): e157. DOI:10.1371/journal.pbio.0040157
Hajjem, C., Harnad, S., & Gringras, Y. (2005). Ten-year cross disciplinary comparison of the growth of OA and how it increases citation impact. Retrieved August 26, 2009, from http://eprints.ecs.soton.ac.uk/11688/01/hajjem.pdf
Harnad, S. (1990). Scholarly skywriting and the prepublication continuum of scientific inquiry. Psychological Science 1, 342-343, Retrieved November 9, 2009, from: http://www.cogsci.soton.ac.uk/~harnad/Papers/Harnad/harnad90.skywriting.html
Harnad, S. (1991). Post-Gutenberg Galaxy: The fourth revolution in the means of production of knowledge. Public-Access Computer Systems Review, 2(1): 39 - 53. Retrieved October 1, 2009 from http://www.cogsci.soton.ac.uk/~harnad/Papers/Harnad/harnad91.postgutenberg.html
Harnad, S., Brody, T., Vallieres, F., Carr, L., Hitchcock, S., Gingras, Y, Oppenheim, C., Stamerjohanns, H., & Hilf, E. (2008). The access/impact problem and the green and gold roads to open access: an update. Serials Review 34(1), 36-40.
Harnad, S.,Brody, T.Vallières, F.Carr, L.,Hitchcock,S., Gingras,Y.,Oppenheim,C., Stamerjohanns, H.,Hilf, E.(2004). The access/impact problem and the green and gold roads to Open Access. Serials Review, 30(4), 310-314.
Harnad, S., & Brody, T. (2004). Comparing the impact of Open Access (OA) vs. non-OA articles in the same journals. D-Lib Magazine, 10(6). Retrieved November 10, 2009 from: http://www.dlib.org/dlib/june04/harnad/06harnad.html
Harter, S. P. (1996). The impact of electronic journals on scholarly communication: A citation analysis. The Public-Access Computer Systems Review, 7. Retrieved November 10, 2009, from http://info.lib.uh.edu/pr/v7/n5/hart7n5.html/
Hirsch, J. E. (2005). An index to quantify an individual’s scientific research output. Proceedings of the National Academy of Sciences of the United States of America, 102(46).
Hitchcock, S., Brody,T, Gutteridge,C., Carr, L. & Harnad, S. (2003).The impact of OAI-based search on access to research journal papers. Serials, 16(3), 255-260.
Hult, G.T.M., Neese, W.T., & Bashaw, R.E. (1997). Faculty perceptions of marketing journals. Journal of Marketing Education, 19(1), 37-52.
ISI. (2004). The impact of Open Access Journals: A Citation Studyfilm. Thomson ISI. [Online]. Available: http://www.isinet.com/media~presen~g,/acropact-oa-jos. [Accessed: October 10, 2009].
Jobber, D., & Simpson, P. (1988). A citation analysis of selected marketing journals. International Journal of Research in Marketing, 5(2), 137-42.
Kousha,K., Abdoli, M. (2009). The citation impact of open access agricultural research: a comparison between OA and Non-OA publications. World Library and Information Congress 75th IFLA General Conference and Assembly. http://www.ifla.org/files/hq/papers/ifla75/101-kousha-en.pdf [Accessed: October 04, 2009]
Kurtz, M.J. (2004). Restrictive access policies cut readership of electronic research journal articles by a factor of two. Harvard-Smithsonian Centre for Astrophysics, Cambridge, MA. http://opcit.eprints.org/feb19oa/kurtz.pdf
Lawrence, S. (2001). Free online availability substantially increases a paper's impact. Nature, 411, 521. Retrieved Ocotber 2, 2009, from http://www.nature.com/nature/debates/eaccess/Articles/lawrence.html
Luke, R.H., & Doke, E.R. (1987). Marketing journal hierarchies: Faculty perceptions, 1986-1987. Journal of the Academy of Marketing Science, 15(2), 74-8.
McVeigh, M. E. (2004). Open Access Journals in the ISI citation databases: Analysis of impact factors and citation patterns. Retrieved November 10, 2009 from http://science.thomsonreuters.com/m/pdfs/openaccesscitations2.pdf
Meho, L., & Yang, K. (2007). Impact of data sources on citation counts and rankings of LIS faculty: Web of Science versus Scopus and Google Scholar. Journal of the American Society for Information Science and Technology, 58(13), 2105-2125.
Mylonopoulos, N.A., & Theoharakis, V. (2001). Global perceptions of IS journals. Communications of the ACM, 44(9), 29-37.
Nelson, T. M., Buss, A. R., & Katzko, M. (1983). Rating of scholarly journals by chairpersons in the social sciences. Research in Higher Education, 19(4), 469-497.
Nisonger, T.E. (1999). JASIS and library and information science journal rankings: A review and analysis of the last half century. Journal of the American Society for Information Science, 50(11), 1004-1020.
Norris, M.,Oppenheim, C., Rowland, F. (2008). The citation advantage of open-access articles. Journal of the American Society for Information Science and Technology. DOI: 10.1002/asi.20898 Retrieved from: http://dx.doi.org/10.1002/asi.20898
Okubo, Y. (1997). Bibliometric indicators and analysis of research systems: Methods and examples. Translated from the French by the OECD (Paris: OECD, 1997).
Paternoster, R., Brame, R., Mazerolle, P., & Piquero, A. (1998). Using the correct statistical test for the equality of regression coefficients. Criminology, 36(4), 859-866.
Thomas, C., & McDonald, R. H. (2007). Measuring and comparing participation patterns in digital repositories. D-Lib Magazine, 13(9/10), 1082-9873.
Ware, M. (2006). Scientific publishing in transition. Bristol: Mark Ware Consulting.
Weingart, P. (2005). Impact of bibliometrics upon the science system: Inadvertent consequences? Scientometrics, 62(1), 117-131.
Winer, B. J. (1971). Statistical principles in experimental design (2nd ed.): McGraw Hill.
Olaf Zawacki-Richter is Professor at the FernUniversität in Hagen (Germany) and the University of Maryland University College (USA). He teaches courses on educational technologies, instructional design, educational management and research methods. E-mail: olaf.zawacki-richter@fernuni-hagen.de
Terry Anderson is Professor and Canada Research Chair in Distance Education at Athabasca University — Canada’s Open University. He teaches educational technology courses in Athabasca University Masters and Doctorate of Distance Education programs. E-mail: terrya@athabascau.ca
Nazime Tuncay is a doctoral candidate in the Computer Education and Instructional Technology Department at Near East University (North Cyprus). She holds a MSC in Applied Mathematics and Computer Science. Her research interests include distance education, e-education, vocational education and web tools. E-mail: nazime07@yahoo.com